Search & Filter Energy Data in Usage Explorer
Use the Usage Explorer to search and filter your data to find exactly what you are looking for.
Select date ranges, intervals, and more with just a few quick selections.
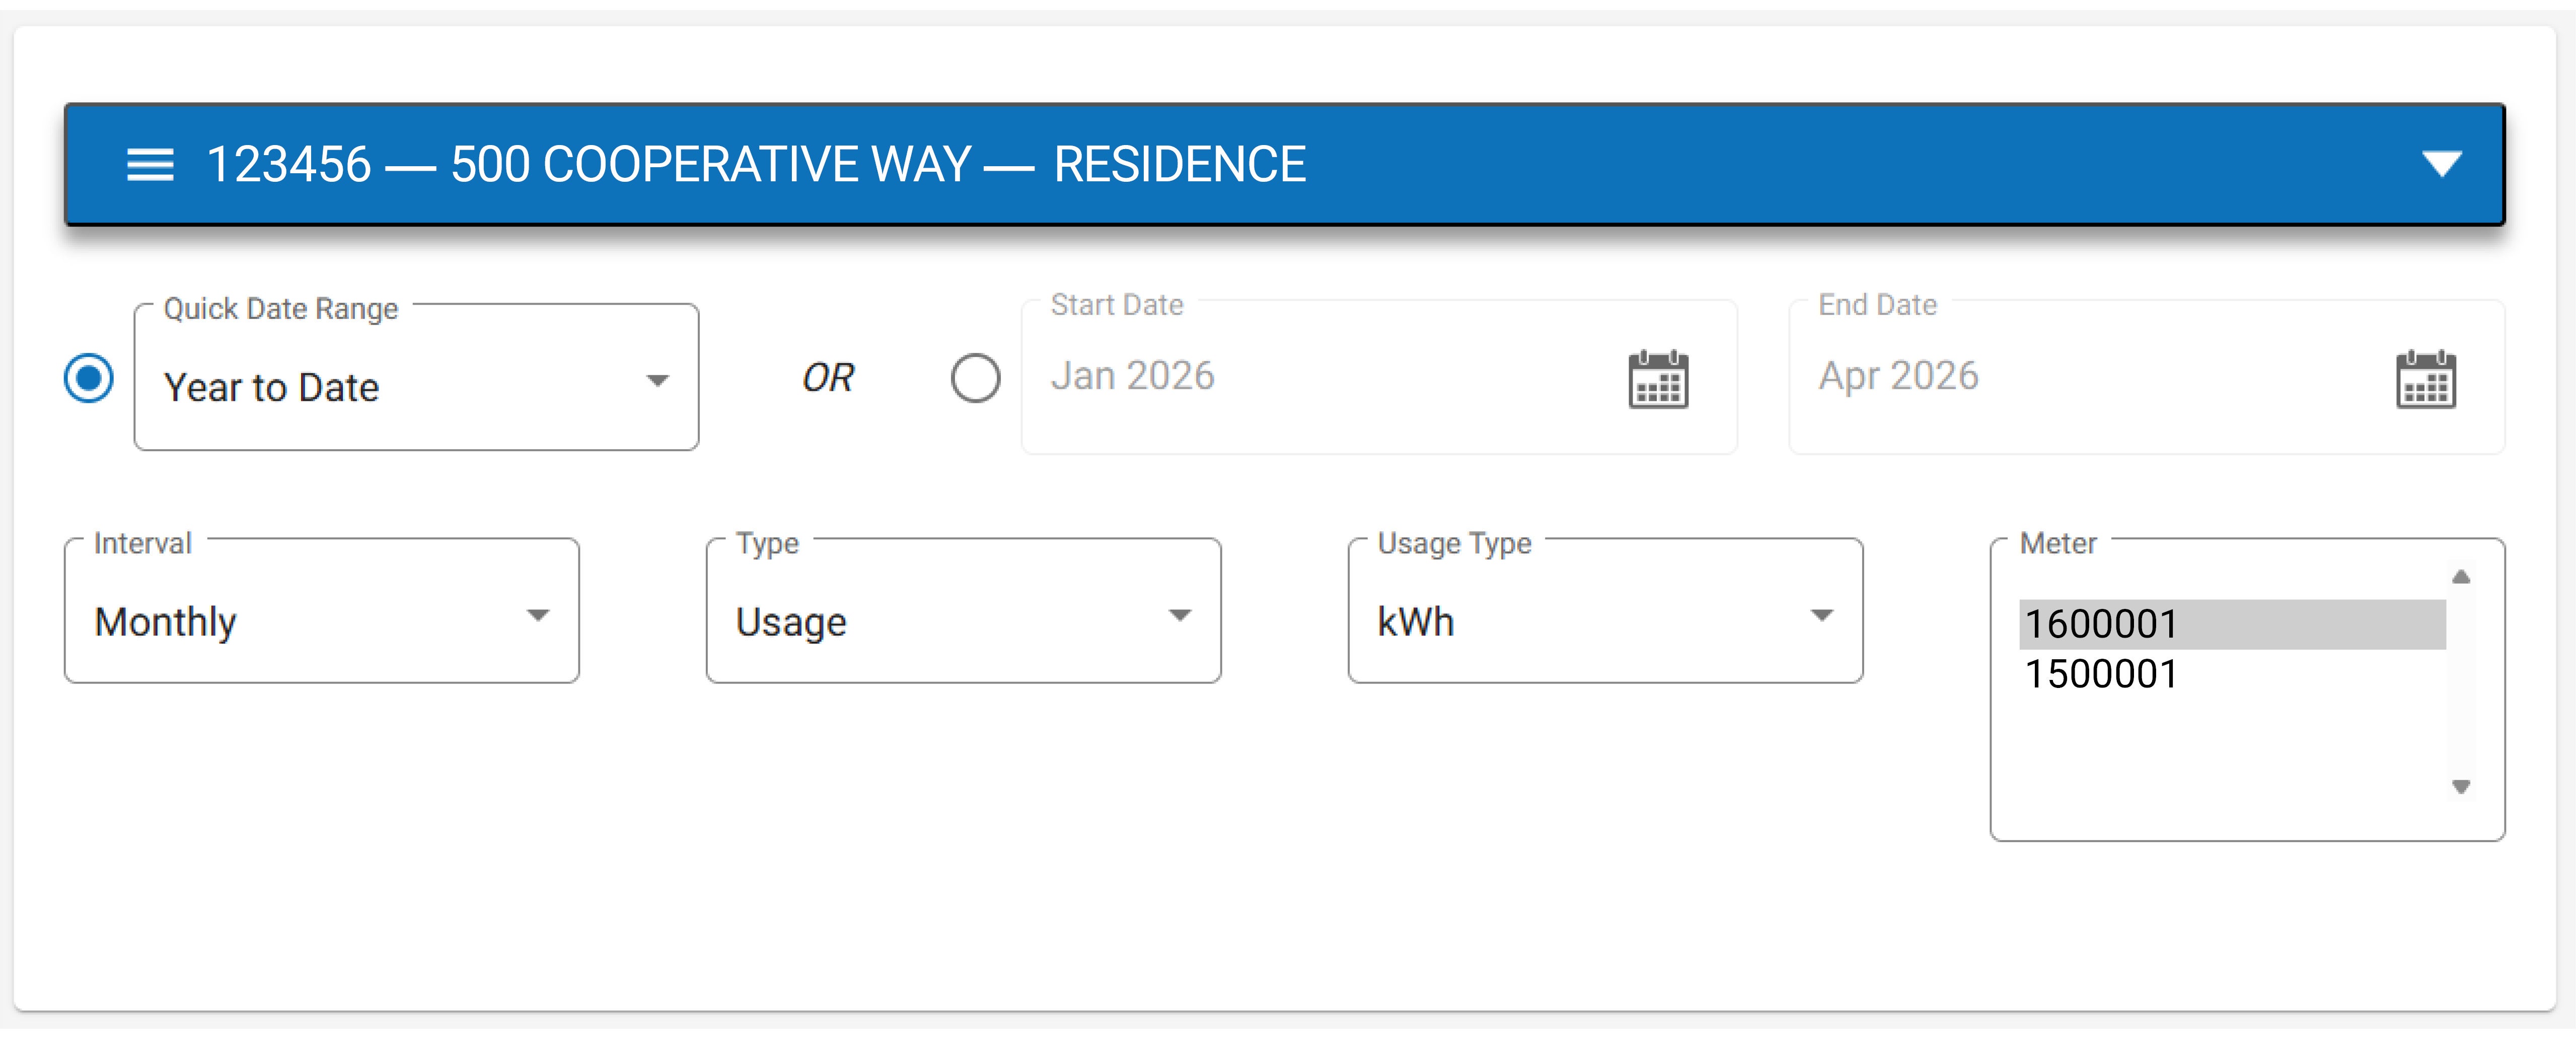
Quick Date Range: Quickly find information based on preselected periods or search a specific date range.
Interval: Choose your data orientation. View in monthly, daily, or 15-minute interval segments.
Type: Members on a time of use rate can see their data broken out into on- and off-peak usage.
Usage Type: View energy (kWh), demand (kW), or both.
Meter: Solar net meter members will have both a billing meter and a production meter while members without rooftop solar will only have a single meter displayed.
View Net Metering Activity & Usage Data
The Usage Explorer can help you figure out how effectively you are using your solar system's production.
Understanding the Terms:
Generation - Excess energy (kWh) your system produced and pushed back to United Power
Consumption - Energy (kWh) you are using from United Power
Net - Difference between consumption and generation (negative number indicates overproduction)
View Solar Production Data
Generation from your solar system is pushed through a different meter and this helps track your system's production over time.
Recommendation: View this data independently from your net meter data. Only excess production from your solar system is pushed through the net meter. Any solar power you use throughout the day will never see that meter, which can create confusion when looking at the two meters together.
- Example: If your system produced 850 kWh and you used 300 kWh, the production meter would show 850 kWh but the billing meter would only show 550 kWh (displayed under the "generation" label).
Note: If your solar system is paired with an app from your provider, these numbers may not match. United Power's default production data is pulled over a billing cycle, while most apps pull month-to-month. To see similar data, you will need to enter a custom date range.
View Demand Data
View your demand (kW) alongside energy (kWh) use data, or view them separately. Usage Explorer will only reflect each new peak demand that has been set for a billing cycle, so you may only see a single spike on the bar graph depending on your consumption.
- Demand can be displayed in either monthly or daily views.
- Daily view will provide the best detail to help determine what is driving your demand.
Demand represents the 15-minute interval with the highest amount of electricity used during that billing month – measured in kilowatts (kW). Learn more about demand.
View Daily Interval Data
View your energy usage and solar generation data in 15-minute intervals. These intervals drive your demand, and viewing by intervals helps you understand exactly which activities or behaviors are having the biggest impact on your energy usage and electric bill.
There are two ways to navigate to this view in the Usage Explorer:
- Click on a month from the chart to see a daily view. Click on any day to see the interval view. You can zoom in even closer using your mouse from the interval view.
- Set your date range (a smaller range will display better) and select "interval" from the Interval menu. Information will autopopulate as you adjust your search, although there may be a slight delay.
Additional Usage Explorer Tools
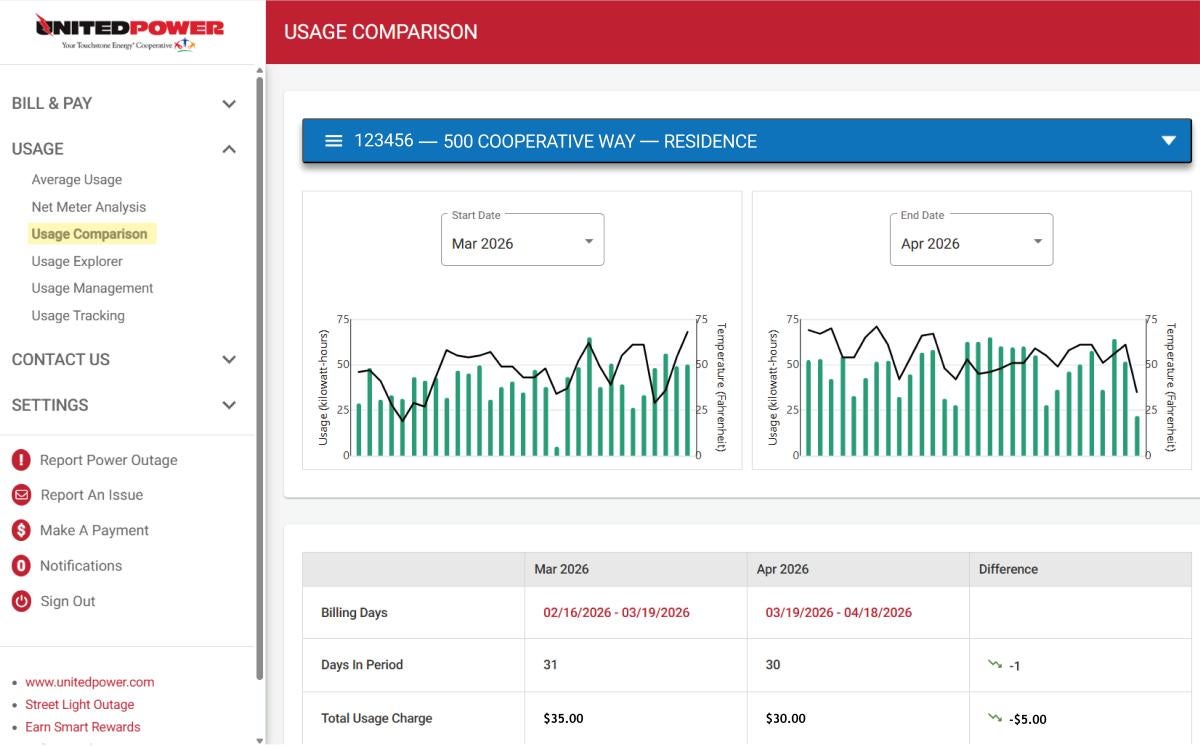
Usage Comparison
Compare your energy usage across billing cycles in SmartHub with the Usage Comparison tool. View month-to-month data to see how your usage has changed, including differences calculated across months.
Navigate to the Usage Comparison tool by clicking Usage in the SmartHub menu bar.
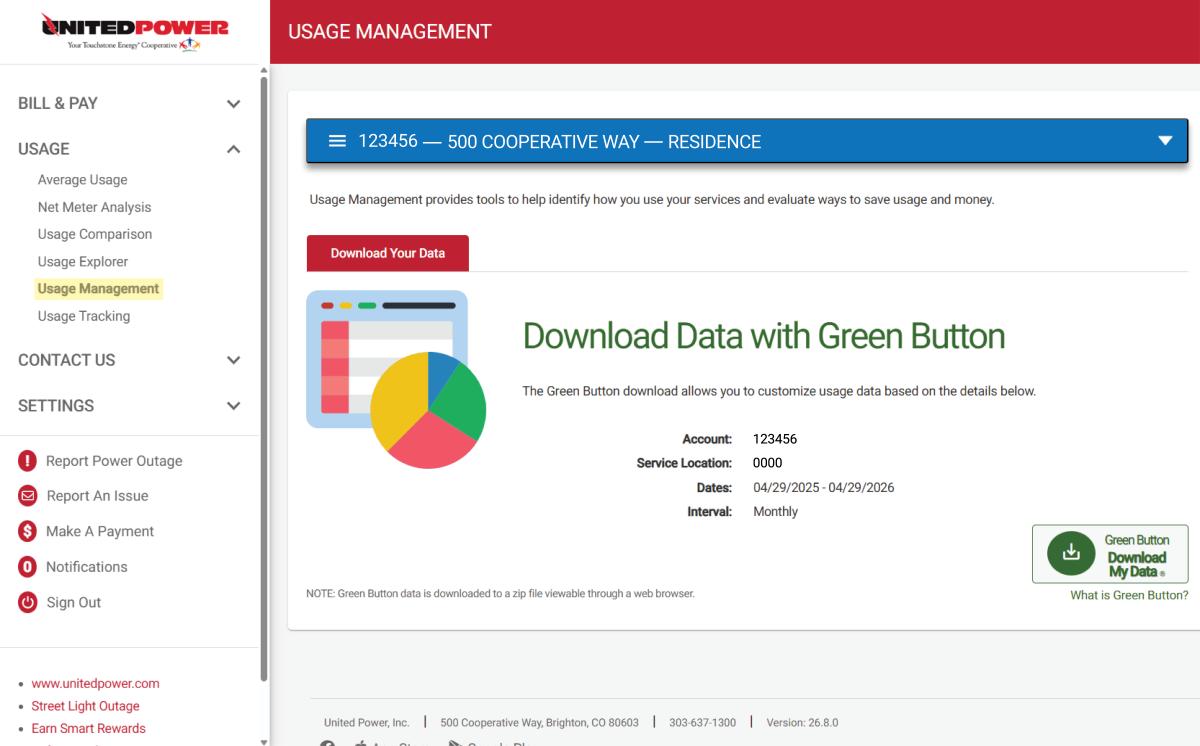
Usage Management
Download your energy usage data with Green Button. Data can be exported in monthly, daily, or even interval periods across a specified time range in an easy-to-ready Excel file format.
Navigate to the Usage Management tool by clicking Usage in the SmartHub menu bar.
Note: Toggle the file format to CSV to get an easily downloadable file.
Usage Tracker
Add trackers to your usage history to note energy efficiency upgrades (e.g., heat pumps) or the addition of a large energy consumer (e.g., an electric vehicle charger) to see how it is impacting your consumption.
Navigate to the Usage Tracker tool by clicking Usage in the SmartHub menu bar.