In the past few issues of the United Newsline, United Power has been discussing the new residential demand rate that will go into effect in 2019. This month, members will begin seeing a new line on their monthly bills: a Demand Charge. This new line is appearing ahead of next year’s rate change to prepare and educate members on this shift in thinking about their electric consumption.
For the remainder of 2018, your bill will show a Demand Charge with an associated kilowatt (kW) measurement, reflecting the highest 15 minute interval of power use over that month’s billing period. There is currently no charge associated with the Demand Charge (kW) line item, but by printing this new item on member’s electric statements and presenting a new online resource – the Power Portal – members have the information to pinpoint what drives their monthly demand and take steps to control their energy consumption.
The Power Portal is United Power’s newest resource for members, and offers a detailed look at monthly energy consumption data and overall usage history. This free resource allows members to view monthly, daily and hourly energy use in 15 minute intervals. By graphing and making notes of highest usage intervals, members can determine what activities contribute to their energy and demand, and monitor any impact changing behaviors can make. For instance, by looking at the portal data you may see that your highest demand corresponded with a big dinner you hosted for family or a day when you were baking and doing laundry at the end of a long week. The Portal provides the records to determine what activities had the most affect on your demand.
The Board will review proposed rate changes this fall, with the intention of introducing the rate slowly and incrementally over a four-year period. The process includes an extensive Cost of Service study, so rates are designed to reflect how the members affect our costs. Residential demand charges will be lower than commercial members.
“Since we have detailed information about how members use power in their homes, the new demand rate will be a fairer way for us to bill members for their use,” stated Dean Hubbuck, Power Supply & Rates Director. “Residential users maximum impact on the system is lower than commercial customers, and their rates will reflect the difference. We believe a modest demand charge with a reasonable energy rate is the best way to recover our costs.”
Beginning in 2019, bills will show a charge for demand, accompanied by a corresponding reduction in the Energy Charge (kWh). The Demand Charge is figured by multiplying the highest demand interval (kW) by the per kW rate. Before final demand rates are approved, United Power is encouraging members to learn more about their personal electric usage and how they can make subtle changes to save even more.
You Have the Power
Curious to see when you used the most energy this past month? Was it the high temps or maybe your new hot tub using more energy than you expected? Use the Power Portal to pinpoint what’s driving your energy use. Access your complete energy consumption portfolio in 15-minute increments throughout the day to get a clear look at how you use energy.
To use the Power Portal, login and click on My Consumption Data. Under the Usage Dashboard, select the Account to view, choose Current Month from the drop-down and select Billing Month. Under the blue bar chart, you may need to click the Demand option to turn on the orange Demand line in the graph. The orange diamond indicates the interval with the highest demand. Click the blue bar to display each 15-minute interval from that day. Hover over the graph for more detail.
Learn more about the Power Portal and how to register at www.unitedpower.com/powerportal.
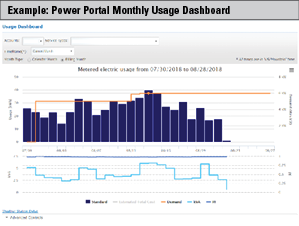
The monthly view in the Power Portal presents your energy use for each day. Choose to view the month by calendar month to see the first through the last day of the month, or view by billing month to view from the first day through the last day of that billing cycle. Viewing your monthly usage helps highlight trends in when you use the most energy.
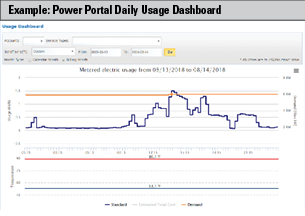
By clicking on any blue bar representing daily energy use, you can zoom in to see every hour of the day by 15-minute intervals. This view can help you pinpoint the interval driving your peak and help you recall activities in your home that contributed.